Architectural Diagrams: Types, Techniques, and Technological Advances
This article explores the significance, creation, and evolution of architectural diagrams, which are essential tools for architects to visualize, communicate, and execute building designs.
In the realm of architecture, where precision meets creativity, "architectural diagrams" stand as pivotal tools, bridging conceptual ideas and tangible structures. These diagrams are not merely technical representations; they are the foundational language through which architects communicate complex concepts, turning abstract visions into detailed plans. The power of an architectural diagram lies in its ability to succinctly convey the essence of a design, making it comprehensible not just to architects and builders, but also to clients and stakeholders.
But what exactly are architectural diagrams? At their core, they are detailed drawings or illustrations that depict various aspects of a building or structure, ranging from layout and design to electrical and plumbing systems. These diagrams serve as vital blueprints, guiding every phase of the architectural process—from initial concept to final construction.
Now, consider this: Imagine the architectural landscape without these diagrams. How would architects convey their groundbreaking designs? How would builders translate these designs into physical forms? This thought underscores the indispensable role of architectural diagrams in the world of architecture. They are not just tools for representation; they are essential for innovation, communication, and execution in architectural projects.
In this comprehensive guide, we embark on a journey to explore the multifaceted world of architectural diagrams. From understanding their types and purposes to delving into the intricacies of their creation, this exploration aims to illuminate the significance and impact of architectural diagrams in shaping our built environment.
Foundations of Design: The Basics of Architectural Diagrams
At the heart of every architectural project lies the fundamental tool of "architectural diagrams." These diagrams, often considered the blueprint of architectural design, serve as critical instruments in visualizing and planning structures.
Definition and Essence:
An architectural diagram, in its broadest sense, is a graphical representation that illustrates the features of an architectural design. These diagrams range from basic sketches to detailed plans and elevations, each serving a specific purpose in the design process. They provide a visual language for architects to express ideas, conceptualize spaces, and detail the physical components of a building.
Historical Perspective:
The history of "diagramming in architecture" traces back to ancient civilizations. Early architects and builders relied on rudimentary diagrams to plan and construct structures that have stood the test of time. Over centuries, these diagrams have evolved from simple hand-drawn sketches to intricate digital renderings, reflecting the technological advancements and changing styles in architecture.
Evolution and Innovation:
The evolution of architectural diagrams mirrors the progress of architectural practices and tools. With the advent of new technologies, such as Computer-Aided Design (CAD) and Building Information Modeling (BIM), "architecture diagrams" have become more precise and detailed. Today, they not only depict the physical layout but also incorporate aspects like material specifications, environmental impact, and energy efficiency.
The journey of architectural diagrams from ancient etchings on stone to sophisticated digital models exemplifies the continuous innovation in the field of architecture. These diagrams have become more than mere tools for drafting; they are now integral components in the narrative of architectural creation, enabling architects to push the boundaries of design and construction.
Diverse Forms, Unified Purpose: Types of Architectural Diagrams
In the vast expanse of architectural design, "architectural diagrams" take on various forms, each tailored to communicate specific aspects of a building or structure. Understanding these different types is crucial for architects, as it allows them to choose the appropriate diagram to articulate their vision effectively.
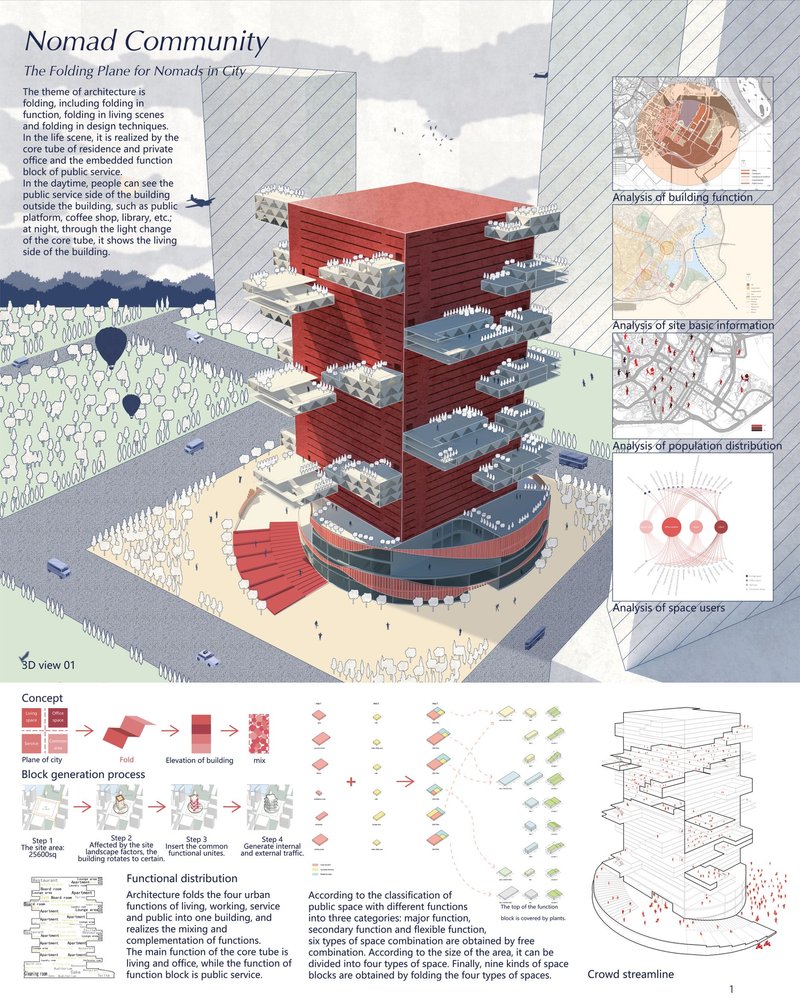
Here is a comprehensive list of 50 different types of architectural diagrams (but not limited to):
- Site Plan: Depicts the entire layout of a building site including boundaries, structures, and landscape elements.
- Floor Plan: Shows a building’s interior layout from a top-down perspective, detailing room sizes and spaces.
- Elevation: Illustrates the exterior views of a building from each side, showing height, design elements, and materials.
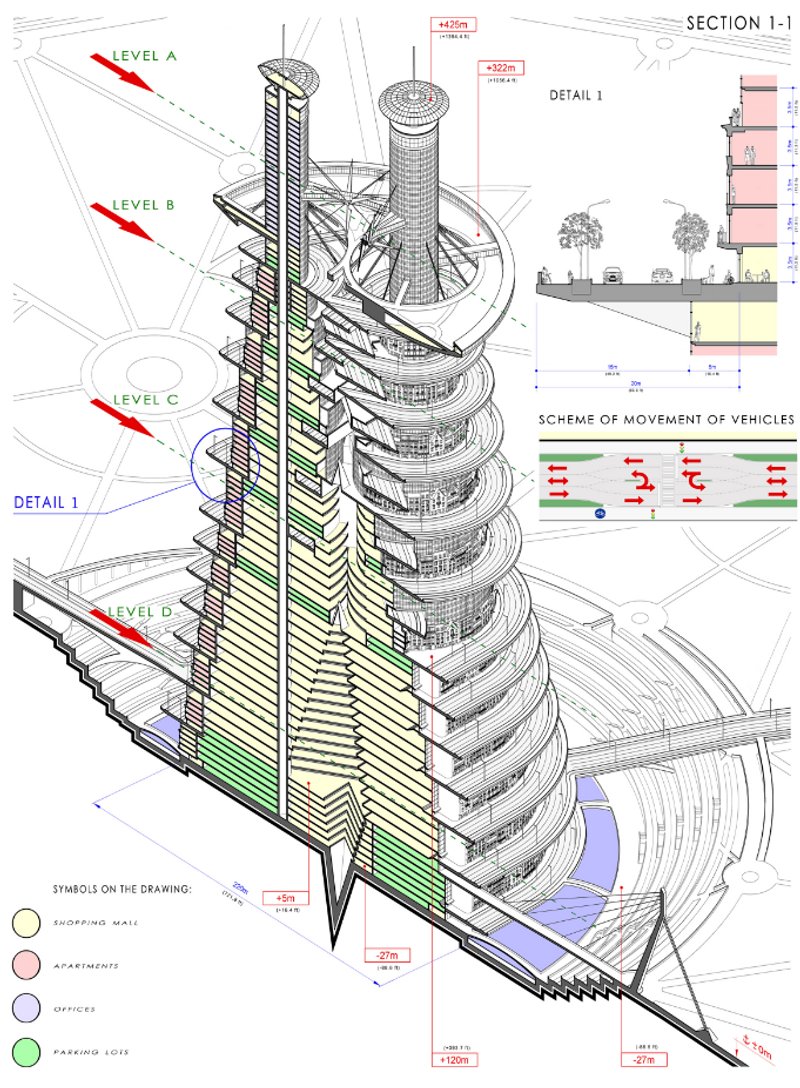
- Cross Section: Cuts through a building vertically to show interior structure, spaces, and material layers.
- Longitudinal Section: A vertical cut through the length of a building, showing internal heights and structural elements.
- Detail Drawing: Focuses on specific elements of a building, providing intricate details on construction methods and materials.
- Axonometric Drawing: Provides a 3D view of an object or building without perspective distortion, maintaining scale in all directions.
- Perspective Drawing: Shows a building in 3D with realistic depth and spatial relationships.
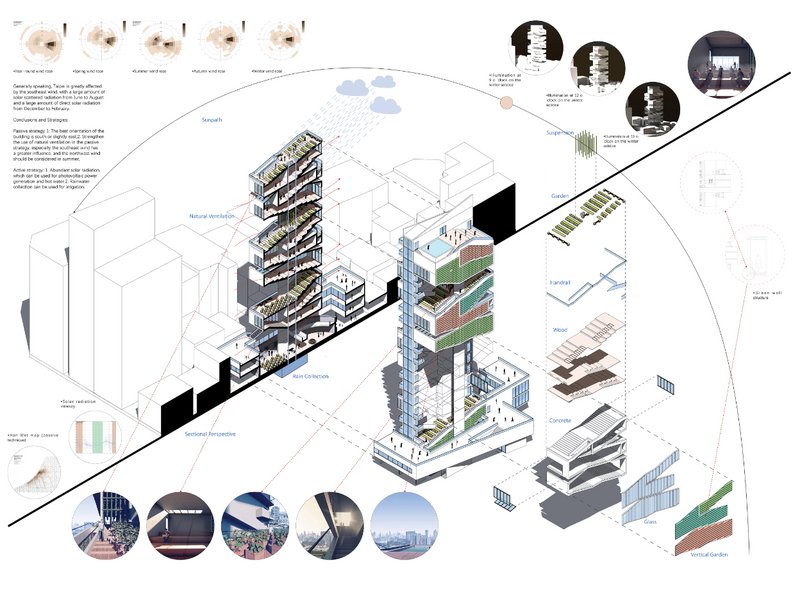
- Topographic Diagrams: Illustrate the physical features of a landscape, including elevation changes and landforms.
- Landscape Layout: Plans the design of outdoor spaces, including plants, terrains, and structures.
- Bubble Diagrams: Conceptual diagrams that show the relationships between different spaces or functions.
- Block Diagrams: Simplified diagrams showing the basic layout and interconnections between building components or systems.
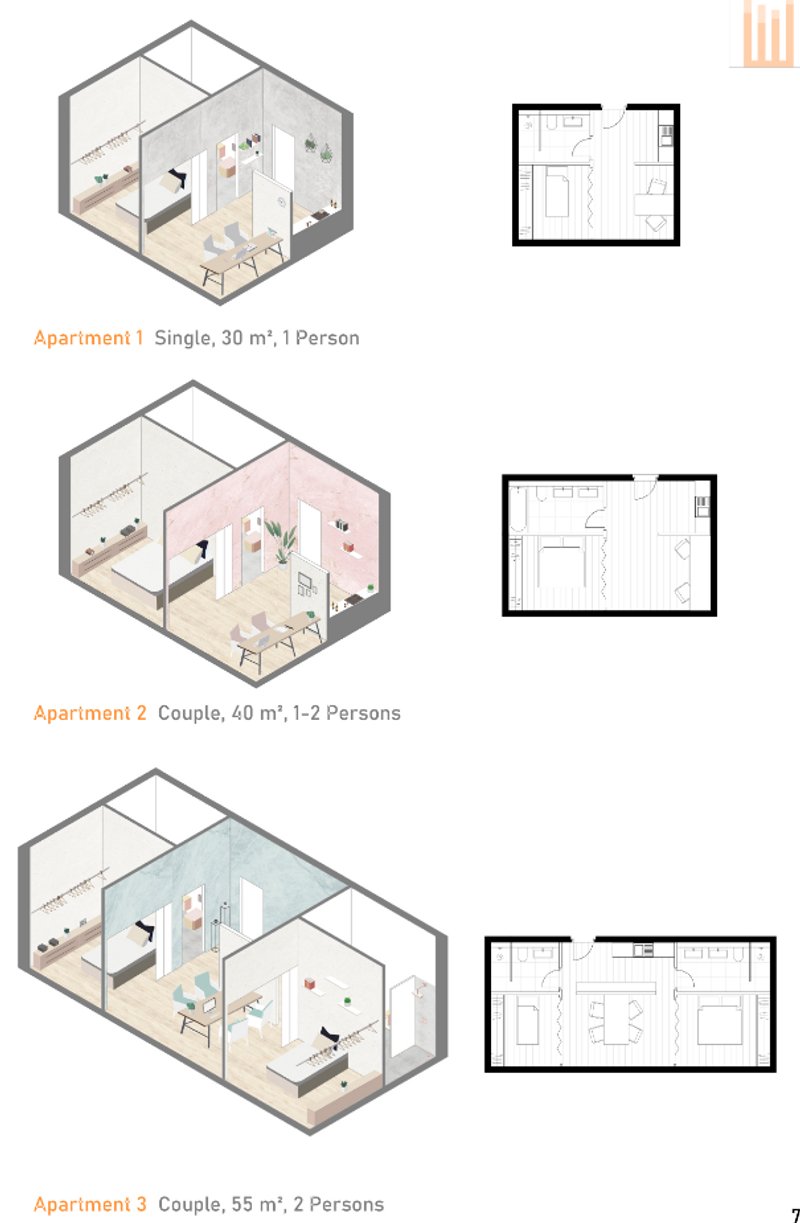
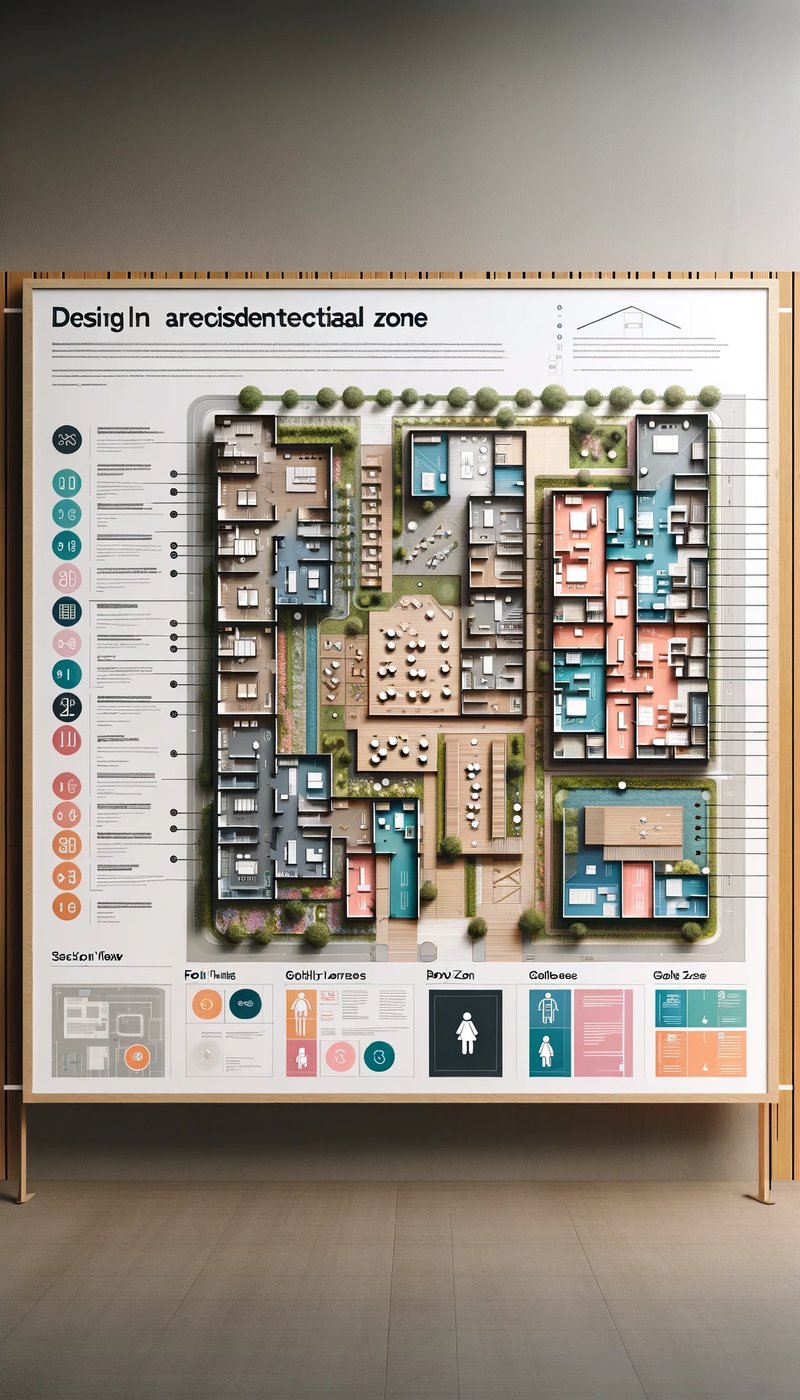
- Space Planning Diagrams: Layouts for interior spaces, showing how rooms and areas are organized and used.
- Functional Diagrams: Illustrate the functional relationships and processes within a building.
- Concept Diagrams: Abstract representations that convey the main ideas or concepts of a building design.
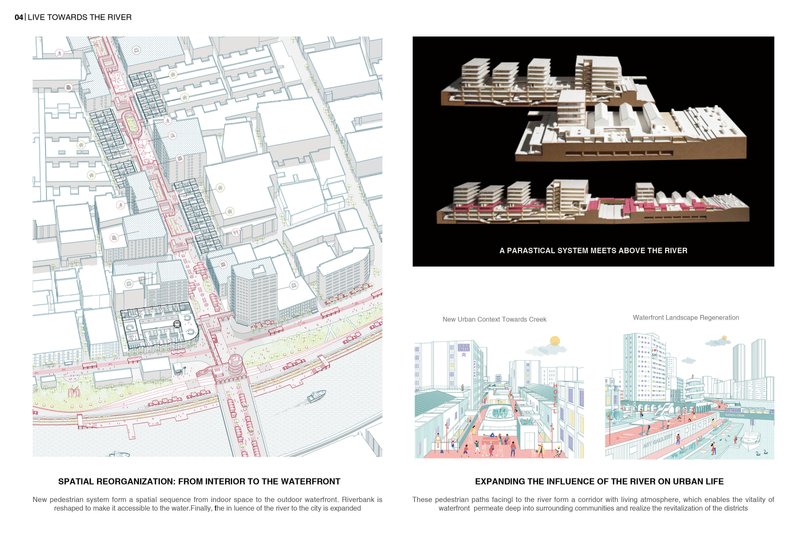
- Urban Planning Diagrams: Show the layout and design of urban spaces, including buildings, roads, and public spaces.
- Master Plan Diagrams: Comprehensive plans showing the long-term development strategy of a large area or building complex.
- Circulation Diagrams: Map the flow of people, goods, or vehicles through a building or urban space.
- 3D Renderings: Realistic three-dimensional images of buildings or spaces, often used for presentations and marketing.
- Wall Section Diagram: Details the construction of exterior or interior walls, showing materials and layers.
- Isometric Drawing: A 3D representation of a structure where the axes are equally inclined to the plane of projection.
- Construction Details: Provide specific information on the assembly and materials of various building components.
- Building Scheme: Outlines the general concept and strategy for a building's design and construction.
- Furniture Layout: Plans the arrangement of furniture within an interior space for optimal use and aesthetics.
- Environmental Impact Diagram: Analyzes a building's effect on its environment, including sustainability aspects.
- Accessibility Diagrams: Show how a building is accessible to people with disabilities, detailing ramps, elevators, etc.
- Shadow Study: Analyzes the shadows cast by a building or structure throughout different times of the day and year.
- Wind Flow Diagram: Illustrates how wind moves around and through a building, important for ventilation and environmental analysis.
- Sun Path Diagrams: Maps the trajectory of the sun relative to a building, crucial for natural lighting and energy efficiency.
- Acoustic Plan: Designs the sound environment of a building, detailing materials and structures for sound control.
- Fire Escape Plan: Outlines evacuation routes and safety measures in case of a fire.
- Security Plan: Details the security measures and systems integrated into a building's design.
- Water Supply and Drainage Plan: Maps out plumbing, water supply, and waste management systems.
- Structural Diagram: Shows the structural elements of a building, like beams, columns, and load-bearing walls.
- Roof Plan: Details the design and construction of a building's roof, including materials and structure.
- Façade Diagram: Focuses on the exterior skin of a building, detailing materials, patterns, and design elements.
- Building Ecosystem Diagram: Illustrates the building's interactions with its surrounding environment.
- Exploded Axonometric Diagram: Shows the building components separated but in correct relation to each other.
- Seating Plan: Layout for seating arrangements, often used in theaters, auditoriums, and event spaces.
- Staircase Diagram: Details the design and construction of staircases, including dimensions and materials.
- Material Plan: Specifies the materials to be used in various parts of the building, including finishes and textures.
- Assembly Diagram: Shows how different building components fit together in the construction process.
- Demolition Plan: Outlines the process and methodology for safely demolishing a building or structure.
- Renovation Plan: Details the changes and improvements to be made in an existing building or space.
- Historical Preservation Diagram: Plans for the restoration or preservation of historical buildings, maintaining their original character.
- Reflected Ceiling Plan: Shows the ceiling layout of a building from a bird's-eye view, detailing lighting, ceiling finishes, and fixtures, important for interior design and lighting strategies.
- Building Section Perspective: Combines a sectional view and perspective to show external and internal structure of a building in one diagram, useful for understanding interior/exterior relationship.
- Programming Diagrams: Visual representations used in the early planning stages to define the functions and relationships of different spaces and program elements within a building.
- Site Analysis Diagrams: These diagrams provide a comprehensive analysis of the site conditions, including climate, topography, vegetation, and surrounding infrastructure, crucial for informed design decisions.
- Mechanical, Electrical, and Plumbing (MEP) Diagrams: Detailed plans showing the layout and design of mechanical, electrical, and plumbing systems within a building, essential for ensuring functionality and compliance with building codes.
Beyond Lines and Shapes: The Vital Role of Architectural Diagrams in Architecture
The significance of "architectural diagrams" transcends beyond mere representation; they are fundamental in shaping the architectural world. Their role is crucial in various aspects of the architectural process, from initial planning to client communication and obtaining regulatory approvals.
Essential in Planning:
Architectural diagrams are indispensable in the planning phase of any construction project. They help in laying out the spatial arrangement, ensuring that every square inch is utilized efficiently. For instance, the meticulous floor plans of the iconic Empire State Building were integral in visualizing and executing its record-breaking design, contributing to its status as one of the world’s most renowned skyscrapers.
Facilitating Client Communication:
A key function of architectural diagrams is to bridge the gap between architects' visions and clients' expectations. These diagrams serve as a visual tool to present ideas and concepts to clients, making the design tangible and understandable. The Guggenheim Museum in Bilbao, designed by Frank Gehry, is a prime example where complex architectural diagrams helped convey the innovative design to stakeholders, ultimately leading to its realization.
Crucial for Regulatory Approvals:
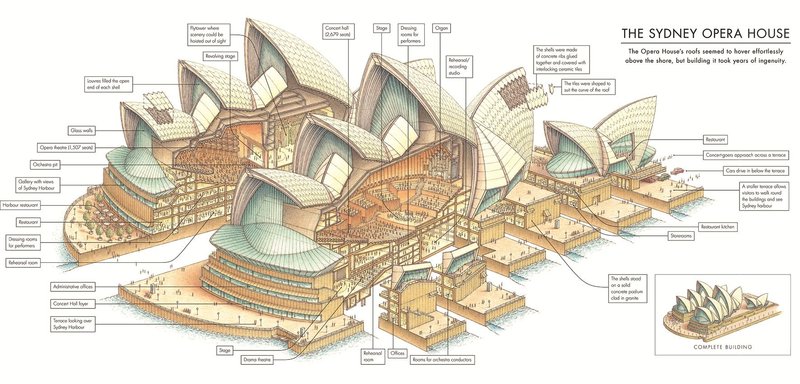
Obtaining regulatory approvals is another area where architectural diagrams play a vital role. Accurate and detailed diagrams are required to demonstrate compliance with building codes and regulations. The design and construction of the Sydney Opera House, for example, involved numerous detailed architectural diagrams to meet strict regulatory standards, ensuring the safety and structural integrity of this iconic structure.
Crafting Precision: The Process of Creating Architectural Diagrams
The creation of "architectural diagrams" is a meticulous and artistic process, combining the precision of science with the creativity of art. This section explores the tools used, the step-by-step process, and offers tips for crafting effective diagrams.
Tools Used in Diagramming:
The toolbox for creating architectural diagrams ranges from traditional to high-tech. Pencil and paper remain fundamental for initial sketches, while advanced software like AutoCAD, SketchUp, and Revit are indispensable for detailed and precise design and renderings. These digital tools offer functionalities like 3D modeling, real-time editing, and collaboration, enhancing the quality and efficiency of diagram creation. Apart from these modern architects are using Rhinoceros 3D along with 2D Design tools like Illustrator and Photoshop to meticulously craft amazing piece of architectural diagrams. However, the current wave of AI is taking things by storm and tools like Midjourney, Stable Diffusion and Dall-E are creating beautiful diagrams in second which are good for generating references at least for now.
Step-by-Step Process:
- Conceptualization: Begin with brainstorming and conceptual sketches to explore ideas.
- Refinement: Develop these ideas into more detailed drawings, focusing on layout, scale, and relationships between different elements.
- Detailing: Add specifics such as dimensions, materials, and technical details.
- Review and Iterate: Continuously review and revise the diagrams, incorporating feedback from clients and other stakeholders.
- Using AI: With AI tools you just need to keep describing things the way you want them to be and it will generate an output.
UNI Membership gives you access to over 100,000 such architectural design diagrams for your reference.
Tips for Effective Diagrams:
- Clarity: Ensure diagrams are clear and legible, with a focus on readability and simplicity.
- Accuracy: Maintain precision in measurements and scales.
- Aesthetics: Balance technical details with aesthetic appeal.
- Communication: Design diagrams to effectively communicate the intended message or concept.
If you want to see step by step tutorials of these projects comment below with the name of the project and we will organize a step by step tutorial or Q&A session with with the creator of this project.
Innovation and Evolution: Emerging Trends in Architectural Diagramming
The field of architectural diagramming is continually evolving, embracing new trends and technologies. This evolution reflects the broader changes in architecture and technology, heralding a future where design and digital innovation intersect.
Latest Trends in Architectural Diagramming:
- Digitalization and Automation: The shift towards digital tools has revolutionized diagramming. Software like BIM (Building Information Modeling) automates and streamlines the design process, making it more efficient and less prone to errors.
- Sustainability Analysis: With a growing emphasis on eco-friendly designs, architectural diagrams now frequently include sustainability assessments, analyzing factors like energy efficiency and environmental impact.
- Integration with Virtual Reality (VR) and Augmented Reality (AR): VR and AR technologies are being increasingly used for immersive presentations and walkthroughs, allowing clients and stakeholders to experience a space before it's built.
- Artificial Intelligence (AI): Use of text to image generation tools like Midjourney, Stable Diffusion and Dall-E can create beautiful diagrams in second which are good for generating references at least for now. However you may also use Controlnet with Stable diffusion to generate these diagrams in a controlled form.
If you want us to organize a step by step tutorial for generating Diagrams for reference using AI. Please comment below with ideas and suggestions, we will organize a step by step tutorial..
Innovations in Digital Tools:
Digital tools are not just transforming the way diagrams are created; they are also changing how they are shared and interacted with. Platforms like Revit and Rhino, along with plugins for parametric design, offer new ways to visualize and manipulate architectural designs. These tools enable architects to create more complex and dynamic diagrams than ever before.
Improving Collaboration and Accessibility:
Cloud-based tools and collaboration platforms are making it easier for teams to work together on architectural diagrams, irrespective of their location. This has led to a more integrated approach to design, where feedback and revisions can be managed in real-time. Use tools like Figma, Miro, with Google Drive, Microsoft Teams and Slack to improve collaboration and efficiency while working in teams.
Real-World Impact: Case Studies in Architectural Diagrams
The true value of "architectural diagrams" is best understood through real-world case studies where they played a pivotal role in the successful realization of architectural projects. Here, we explore a few such case studies, highlighting the impact and importance of architectural diagrams in practical scenarios.
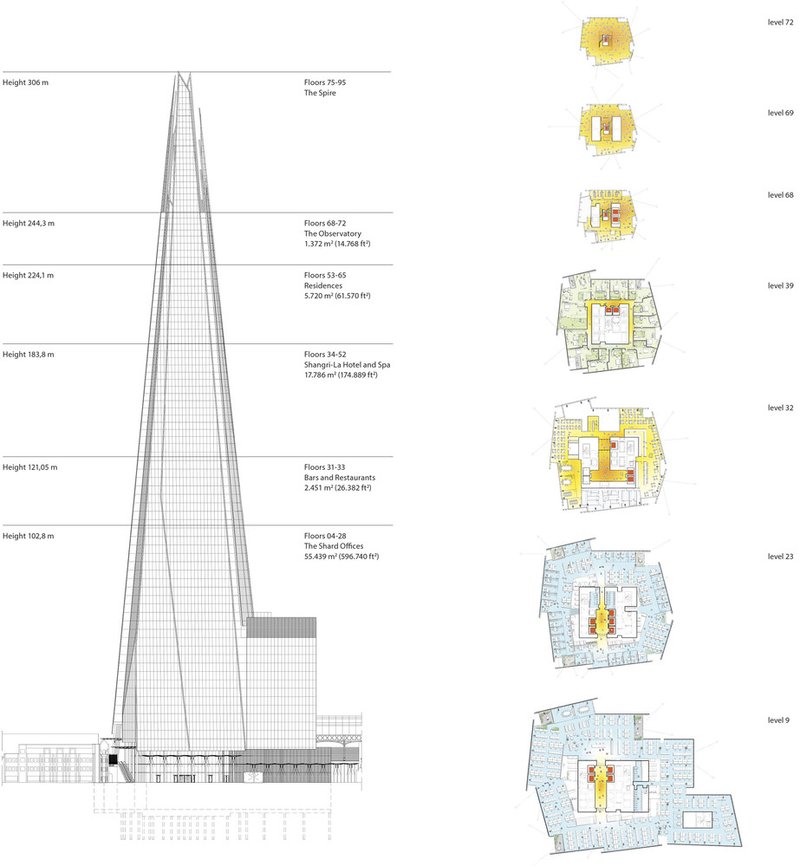
Case Study 1: The Shard, London:
The Shard, designed by Renzo Piano, stands as a testament to the power of architectural diagrams in creating iconic structures. The intricate diagrams for this skyscraper detailed its shard-like glass façade, crucial for achieving its unique aesthetic and structural integrity. These diagrams were pivotal in both the design and construction phases, ensuring that the visionary concept was accurately translated into reality.
Case Study 2: Sydney Opera House, Australia:
The Sydney Opera House, with its complex and distinctive design by Jørn Utzon, relied heavily on detailed architectural diagrams. These diagrams were instrumental in understanding and executing the building's unique roof structure, which posed significant engineering and architectural challenges. The precise diagrams helped in navigating these complexities, leading to the creation of one of the most recognizable buildings in the world.
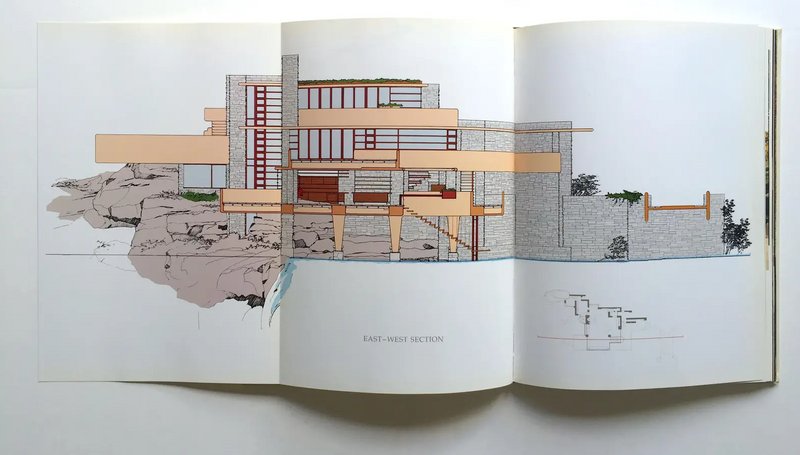
Case Study 3: Fallingwater, Pennsylvania:
Fallingwater, designed by Frank Lloyd Wright, is an epitome of harmonious integration with nature. The architectural diagrams for this project played a crucial role in planning the house's unique cantilevers and its integration with the natural waterfall. These diagrams ensured that Wright's visionary design was feasible and could be constructed without compromising the site's natural beauty.
Through the evolution from hand-drawn sketches to advanced digital renderings, architectural diagrams have continuously adapted, embracing new technologies and methodologies. They serve as vital tools for architects, aiding in planning, communication, design visualization, and ensuring regulatory compliance. The case studies of iconic structures like The Shard, Sydney Opera House, and Fallingwater illustrate how these diagrams transform visionary ideas into architectural masterpieces.
As we look to the future, the field of architectural diagramming is poised for further innovation, integrating sustainability, digitalization, and collaborative platforms. These advancements promise to further enhance the precision, efficiency, and expressiveness of architectural diagrams.
Call to Action
The journey of architectural exploration does not end here. We invite you to delve deeper into the world of architecture by participating in other Competitions on UNI. These competitions offer a platform to showcase your creativity, innovate, and contribute to the architectural discourse.
Furthermore, we encourage you to explore the Conceptual Design Projects on UNI for architectural design reference and inspiration with over 10,000 Project, 100,000 boards and over a million Design diagrams. These projects exemplify the power of architectural diagrams in bringing conceptual ideas to life and could be the catalyst for your next groundbreaking design.
Join us in this ongoing architectural adventure, where every line, shape, and concept has the potential to redefine our built environment.