
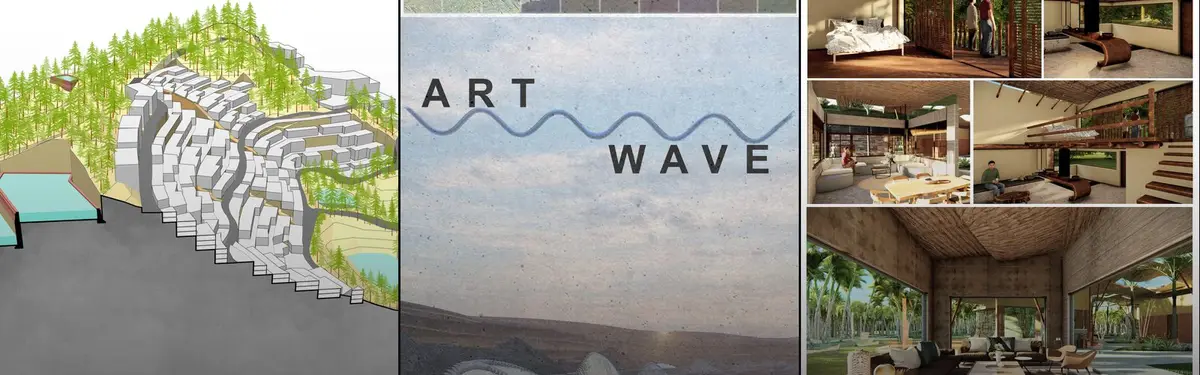


Site Analysis
Understanding site conditions, context, and constraints to inform design decisions.
Site analysis is the study of a piece of land and its surroundings before design begins: where it is, how the sun, wind and water behave on it, how its ground rises and falls, how people reach it, what can be seen from it and what the rules allow on it. The findings are recorded as maps, sections and diagrams, and they become the evidence a designer uses to decide where a building sits, which way it faces and what it should protect or open up to.
What is site analysis?
In architecture, site analysis is the research stage that sits between receiving a brief and drawing a first concept. The brief says what is needed; the site says what is possible. A good analysis answers practical questions: where the noise comes from, which corner gets the afternoon sun, where rainwater collects, where the best view is, which neighbours will be overlooked, and how far the nearest bus stop is. It also records less measurable things, such as the character of the street, the materials of nearby buildings and the way people already use the ground.
Site analysis is not the same as a site plan. A site plan is a drawing of the proposal set on its plot; the analysis is the investigation that comes before it and justifies it. Nor is it a full masterplan. At the scale of a district, the same thinking turns into urban planning, and when the main material is ground, water and planting it overlaps with landscape design. The cultural and historic reading of a place is the core of contextual architecture, which treats context as a design stance rather than a survey task.
In practice the work has two halves. The first is data collection: visits, photographs, measured surveys, climate records, maps and planning documents. The second is interpretation, where the designer sorts that material into constraints and opportunities. The second half matters more. A board full of beautiful diagrams that never changes the design is decoration; a rough sketch that explains why the entrance moved to the quieter street is analysis.
A short history of site analysis
The oldest surviving architectural treatise already starts with the site. In the first book of his Ten Books on Architecture, written in the first century BC, the Roman architect Vitruvius opens his chapter on the site of a city with climate, height and drainage, and warns against marshes whose morning mists drift toward the town.
"First comes the choice of a very healthy site. Such a site will be high, neither misty nor frosty, and in a climate neither hot nor cold, but temperate."
Vitruvius, The Ten Books on Architecture, Book I, Chapter IV (Morgan translation, 1914)
A second milestone is the way architects learned to draw a city. Giambattista Nolli's plan of Rome, surveyed from 1736 and engraved in 1748 on twelve copper plates, shaded built mass dark and left streets and squares white. Nolli also showed enclosed public spaces, such as the colonnade of St Peter's Square and the interior of the Pantheon, as open civic space. That figure-ground convention is still the first diagram many students draw of a new site.

In the twentieth century the subject widened from buildings to people and ecology. Kevin Lynch's The Image of the City (1960), based on a five-year study of Boston, Jersey City and Los Angeles, showed that people build mental maps from five elements: paths, edges, districts, nodes and landmarks. Those five words are still a reliable checklist for the perceptual side of a site. Nine years later the landscape architect Ian McHarg published Design with Nature, which pioneered ecological planning and set out ideas that later developed into geographic information systems (GIS). Reading soils, slopes, water and habitat as separate layers and then combining them is now standard practice.
Today much of the data arrives digitally. Free tools such as the NOAA Solar Calculator give sunrise, sunset and solar position for any point on Earth, and open map data replaces hours of tracing. The method has not changed much since Vitruvius, though: look closely, record honestly, then decide.
Key principles of site analysis
Every site is different, but most analyses cover the same ground. The headings below work as a checklist for a studio project or a competition entry.
Location and context
Start wide and zoom in. A location diagram places the site in its region and city; a neighbourhood map shows land uses, landmarks, schools, transport and open space within walking distance. A figure-ground drawing reveals the grain of the surrounding fabric, whether it is fine and dense or loose and open, and so suggests what scale of building will fit. Photographs of the street edge, heights of neighbouring buildings and dominant materials complete the picture.
Climate, sun and wind
Climate data tells you how hot, wet and windy the place is through the year. The sun path diagram shows where the sun rises and sets at the solstices and how high it climbs, which drives orientation, shading and the placement of outdoor rooms. A wind rose shows prevailing and seasonal winds, which matter for natural ventilation, cold-weather shelter and the comfort of open spaces. Record the microclimate too: a shaded courtyard or a wind tunnel between towers can matter more than regional averages.

Topography, soil and water
Contours and sections show how the ground moves, where it is too steep to build cheaply and where a building could step with the slope. Soil and geology affect foundations and drainage. Water deserves its own map: watercourses, flood zones, surface runoff paths and the water table. Climate change has made this layer more important, because flooding that was rare a generation ago now shapes many briefs.

Access, movement and noise
Map how people, cars, bicycles, service vehicles and emergency vehicles reach the site, and where they come from. Note bus and rail stops, pedestrian desire lines, busy junctions and the quieter edges. Noise sources such as main roads, railways and schools usually decide which side of a building gets bedrooms or classrooms and which side gets stairs and storage.
Views, character and people
Mark the views worth framing and the ones to screen, and the neighbours who could overlook or be overlooked. Then look at how the site is used now: who walks across it, where people sit, what happens at night. Lynch's paths, edges, districts, nodes and landmarks give this part of the survey a vocabulary. Interviews and observation at different times of day often reveal more than any map.
Regulations and synthesis
Planning rules set the envelope: permitted uses, setbacks, height limits, plot coverage, heritage designations and protected trees. The final step is synthesis. Many students use a SWOT summary (strengths, weaknesses, opportunities, threats) or a single opportunities and constraints diagram that overlays the key findings and points to the design moves they suggest. In the UK, the RIBA Plan of Work organises briefing, design, construction and use into eight stages, and site analysis belongs at the front of that sequence, before a concept is fixed.

Site analysis on uni.xyz
Site analysis appears on many members' competition and thesis boards. The projects below show the range, from informal districts to suburban floodplains.
Tinker Project by Karim El Kafrawi is the most liked project in this topic and a winning entry in the Tinker Project competition. Its proposal, Ghiya, takes its cue from the skyline of Cairo's informal districts, especially Manshiyat Naser, and reuses the area's most common materials: red brick, recycled wood and steel. The site analysis board reads the district through a sequence of maps, a skyline study and an environmental analysis before the design begins.

MORE THAN A CHANNEL by Tianyi Jiang, the runner-up in the UnIATA '19 competition, is a water-inspired landscape design in the South East Wedge of Edinburgh. It works with local flood risk instead of against it, giving existing watercourses room to flood safely and using water as a medium for play. Its analysis boards cover geology, topography, hydrology, green infrastructure and user groups, which makes it an unusually complete site study.
Rohit Raj's thesis Structuring the Urban Form with Natural Systems argues that mountain cities need a different logic from cities in the plains and organises urban form around the natural water system. Its boards include slope gradient and hill shadow analyses that turn topography directly into zoning.
URBAN MEAL MINE by Artem Barkhin and Samuel. H. Cutajar. is meant as a link between city and nature, and its statement makes the role of the site explicit.
"The concept for this UMM was developed through a complete understanding of 2 fundamental elements, the brief and the existing site conditions."
Artem Barkhin and Samuel. H. Cutajar., URBAN MEAL MINE project statement

Weather the Storm, a winning entry in the Impart competition by meraj goli, Fahimeh Saeedi, Fatemeh Zareian, bahareh behzadi and Haniyeh Sanaieian, describes itself as a story about observation and accepting challenges, and starts by asking "what if?" of its site's limits and opportunities. GRUNHUIS by Herriot Watt University does the same by hand, with watercolour site plans and sketched sun and circulation studies.
Dopamine Gaming Center by Elaheh Askari, a winning entry in the Reboot competition, is a clear example of analysis leading straight into form: one board moves from sun, wind, noise, neighbours and traffic to a four-step massing sequence.

Challenges and future directions
The first challenge is volume. Open data, satellite imagery and climate files make it easy to produce dozens of diagrams, and the temptation is to show all of them. Reviewers and juries rarely reward that. The useful skill is editing: keeping the five or six findings that actually move the design.
The second is distance. Students increasingly work on sites they never visit, especially in international competitions. Street-level imagery helps, but it cannot record smell, noise, the feel of a slope or the people who use a place at night. When a visit is impossible, say so, and lean on local sources such as residents' accounts, municipal reports and recent photographs.
The third is time. A site is not a fixed object. Rivers move, sea levels rise, neighbourhoods change, and a building will outlast the conditions it was surveyed under. Flood lines, future heat and planned infrastructure now belong in the analysis, as does the social layer: who might be displaced, and who the project is for.

Digital tools will keep improving, from environmental simulation to machine-read land use maps, but they speed up collection rather than judgement. The analysis still has to end in a clear position about what the site asks of the design.
Site analysis for students and designers
For a thesis, site analysis can be the project rather than the preface. Strong angles include designing with flood risk instead of against it, reading informal settlements through their own logic, mapping how a site changes across a day or a season, and testing whether an analysis method from one culture works in another. In competitions, a single synthesis diagram that links findings to design moves usually reads better than a full survey. Browse open briefs on uni.xyz competitions, and compare how members present the resulting drawings under site plan and how they respond to weather under climate-responsive design.
Frequently asked questions
What should be included in an architectural site analysis?
At minimum: location and context, climate (sun path, wind, rainfall and temperature), topography and drainage, access and movement, noise, views, neighbouring buildings, existing vegetation, and the planning rules that apply. Finish with a synthesis, such as a SWOT summary or an opportunities and constraints diagram.
How do you do a site analysis for an architecture project?
Gather maps and climate data, visit the site at different times of day if you can, photograph and sketch, and talk to people who use it. Then draw each layer separately, compare them, and write down the handful of findings that should shape the design.
What is the difference between a site analysis and a site plan?
A site analysis studies the existing conditions of a site before design. A site plan is a drawing of the proposed building and landscape on the plot. The analysis explains why the site plan looks the way it does.
What is SWOT analysis in architecture?
SWOT lists a site's strengths, weaknesses, opportunities and threats. Strengths and weaknesses describe the site as it is; opportunities and threats describe what could happen to it or around it. It is a quick way to turn a long survey into design priorities.
How many sheets should a site analysis take in a competition entry?
There is no fixed number. On a competition board the analysis competes for space with the design, so a single panel or a strip of diagrams is often enough if it shows the layers that explain your key decisions.
References and further reading
- Vitruvius, The Ten Books on Architecture (trans. Morris Hicky Morgan), Project Gutenberg
- Giambattista Nolli and the 1748 plan of Rome, Wikipedia
- The Image of the City (Kevin Lynch, 1960), Wikipedia
- Ian McHarg and Design with Nature, Wikipedia
- NOAA Solar Calculator, NOAA Global Monitoring Laboratory
- RIBA Plan of Work, Royal Institute of British Architects


Popular projects
View all 74 projects


Latest journals
View all 3 journals
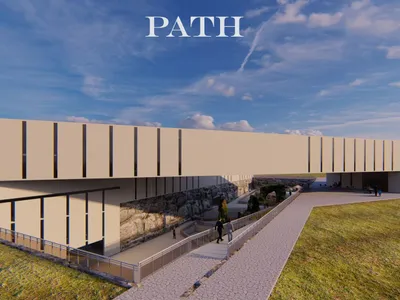
Innovative Geological Museum Architecture: Unveiling the PATH Project in Þingvellir, Iceland
The PATH project is an architecturally innovative geological museum set in Þingvellir, Iceland, designed to offer an interactive journey through the nation's dynamic geological history.

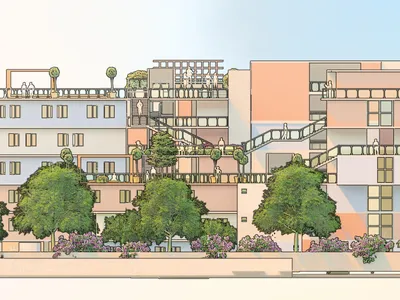
"The Study Hamlet"
The Study Hamlet is an attempt to make the student's life in Phillipines better in all aspects especially to convalescent their mental health. "For a student, enjoying the learning is more important than just studying in four closed walls


