
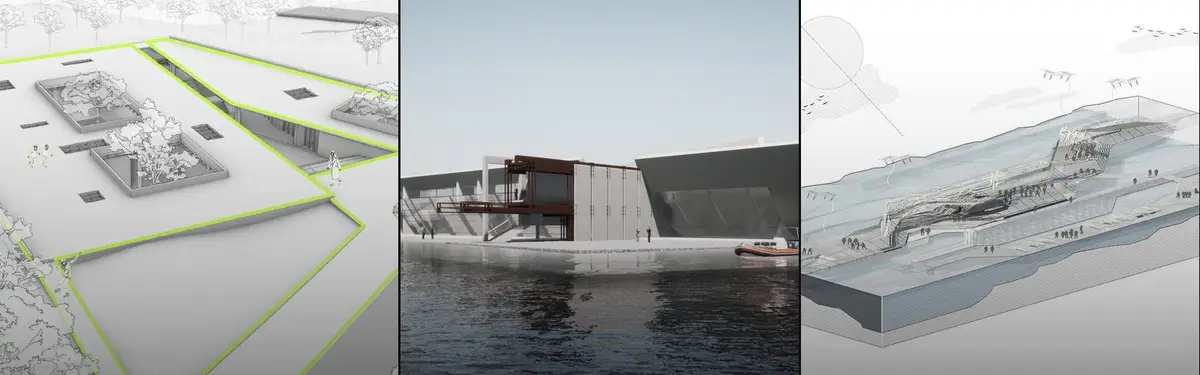


3D Diagram
Three-dimensional visual representations that communicate spatial relationships, systems, and architectural concepts.
A 3D diagram in architecture is a three-dimensional drawing that explains how a building works rather than how it looks: it pulls out one idea, such as the structure, the programme, the route through the spaces or the path of sunlight, and shows it on a simplified volume. Where a render asks the viewer to imagine standing in the finished place, a diagram asks them to understand the logic behind it.
What is a 3D diagram in architecture?
Architects draw diagrams to think and to persuade. The Wikipedia overview of architectural drawing separates the quick sketch, which records an idea, from the diagram, which "uses symbols to develop the logic of a design". The same source notes that diagrams can resolve spatial relationships and can also show forces and flows, such as sun and wind or the movement of people and materials through a building. A plan or section can do some of that work in two dimensions. A 3D diagram does it in axonometric or perspective, so that stacking, overlaps and vertical connections become legible at a glance.
The key difference from a render is selection. A render, the subject of the separate uni.xyz article on 3D visualization, tries to include everything: materials, light, people, weather. A diagram deliberately leaves almost everything out. Walls may become transparent, floors may float apart, colours may stand for uses rather than finishes, and arrows may show movement that no camera could record. That is why one building can need a dozen diagrams but only two or three renders.
"The power of an architectural diagram lies in its ability to succinctly convey the essence of a design, making it comprehensible not just to architects and builders, but also to clients and stakeholders."
UNI, Architectural Diagrams: Types, Techniques, and Technological Advances (uni.xyz journal)
The field overlaps with neighbouring drawing types. An exploded axonometric is one specific kind of 3D diagram, in which a building's layers are pulled apart along an axis. Flat bubble and zoning drawings, collected under the broader diagram topic, often come first and are later lifted into three dimensions once the massing is fixed.
A short history of the architectural diagram
Diagrams go back to prehistoric cave walls but, as the Wikipedia article on diagrams notes, they became more prevalent during the Enlightenment. In architecture, Jean-Nicolas-Louis Durand, professor of architecture at the École Polytechnique from 1795, developed a system of design using simple modular elements, an approach that anticipated modern industrialised building components.
At the end of the century Auguste Choisy pushed the diagram into three dimensions. In his two-volume Histoire de l'architecture (1899), according to the Dictionary of Art Historians, he developed single drawings that combined plan, elevation, section and perspective in one illustration, and used them to read buildings in terms of how they were built. Choisy's figures remain a common reference for the structural diagram.
The diagram also became a way to explain ideas that had no site yet. Ebenezer Howard's garden city proposal, first published in 1898 and reissued as Garden Cities of To-morrow in 1902, rests on a series of numbered diagrams: the Three Magnets, the concentric Garden City and a cluster of towns joined by railways.

"Let me here introduce a very rough diagram, representing, as I conceive, the true principle on which all towns should grow."
One of the best-known diagrams of the twentieth century is Le Corbusier's Maison Dom-Ino of 1914. As documented by the Fondation Le Corbusier, it proposed a frame of standard elements that simply carries the floors and the stair, independent of the plan of the house. Later, Louis Kahn's Richards Medical Research Laboratories became known for the clear expression of served and servant spaces, an idea that is almost impossible to explain without a diagram. Axonometric drawings, including worm's-eye views and exploded elements, featured prominently in influential 1970s work by Michael Graves and James Stirling. Today's presentation boards inherit all of this, with digital models making it quick to cut, colour and separate a design for each diagram.
Key principles and types of 3D diagrams
Every good 3D diagram answers one question. The types below are defined by the question they answer, and each is shown through work published by uni.xyz members or through a historical example.
Concept diagrams
A concept diagram traces the idea a project grows from, often as a short sequence of simple forms. The board for OPERA TRUCK. COOPER by Марк Ли, entered in the Opera Truck competition, starts from thoughts about Malevich's Black Square and turns that starting point into cubes and grids that can be read without the text.

Programme and massing diagrams
Programme diagrams colour or separate volumes by use, and massing diagrams show how those volumes add up to a form. Stacked boxes are the usual vocabulary: each box is a function, its size roughly its area, its position its relationship to its neighbours. The boxes for seats, scene and viewing area on the board above are a compact example.
Structure diagrams
A structure diagram strips away cladding and finishes to show what carries what. Choisy's figures in his Histoire de l'architecture (1899) set the method, and contemporary practice still uses it. In the drawing below, from the UNI journal on Bogdan & Van Broeck's community facility in Molenbeek, the arcade is the only element in colour inside an otherwise plain white volume.

Circulation diagrams
Circulation diagrams draw the route rather than the rooms: stairs, ramps, lifts and corridors as lines or ribbons threaded through a transparent volume. They answer questions about circulation space that a plan can only hint at, such as where a visitor changes level or where two flows cross.
Environmental diagrams
Environmental diagrams show forces that are invisible in a render: sun angles, prevailing wind, rain collection, stack ventilation. They work best when the building is reduced to a pale volume so that the arrows and colour gradients carry the argument.
Process sequences and system diagrams
Some ideas only make sense over time, so the diagram becomes a strip of frames: a volume is cut, lifted, twisted or repeated. System diagrams go one step further and overlay several layers on one drawing. The UNI journal on architectural diagrams opens with a dark axonometric field in which a tower is set on axes labelled structure, co-living, co-working and co-mingling, with floor diagrams for each band pinned around it.

3D diagrams on uni.xyz
Members of uni.xyz publish 3D diagrams mostly as part of competition boards, where a single sheet has to explain a whole scheme. The projects below show the range.
Amorphous Gaming Center by Joud Alsaht, Hanan Alsahin and Fatima Almagboul is the most liked project in this topic. Entered in the Reboot competition, it received the People's Choice Award. The team describes it as a digital universe that takes visitors away from the ordinary gaming field, open to everyone and not only to gamers. The project is also listed under wall section and render section, the drawings that a fluid form like this relies on alongside its diagrams.
Sphere Arena by Selin Gungor and Hakan Bayrak, a winning entry in The Grid competition, gathers e-sports programmes under one roof. A central spherical screen links the gaming, viewing and social areas, so that play becomes a shared spatial experience. A scheme organised around one object is a natural subject for a programme diagram: everything is explained by its relationship to the sphere.

IM-MATERIAL by Şeyda ÜNAL and Şeyma Gül Gümüş, entered in the Athenaeum competition, builds its context from wind, shadow and waves, elements a render can only suggest but a diagram can draw directly.
"What we call architecture is the constitution of image."
Şeyda ÜNAL and Şeyma Gül Gümüş, project statement for IM-MATERIAL on uni.xyz
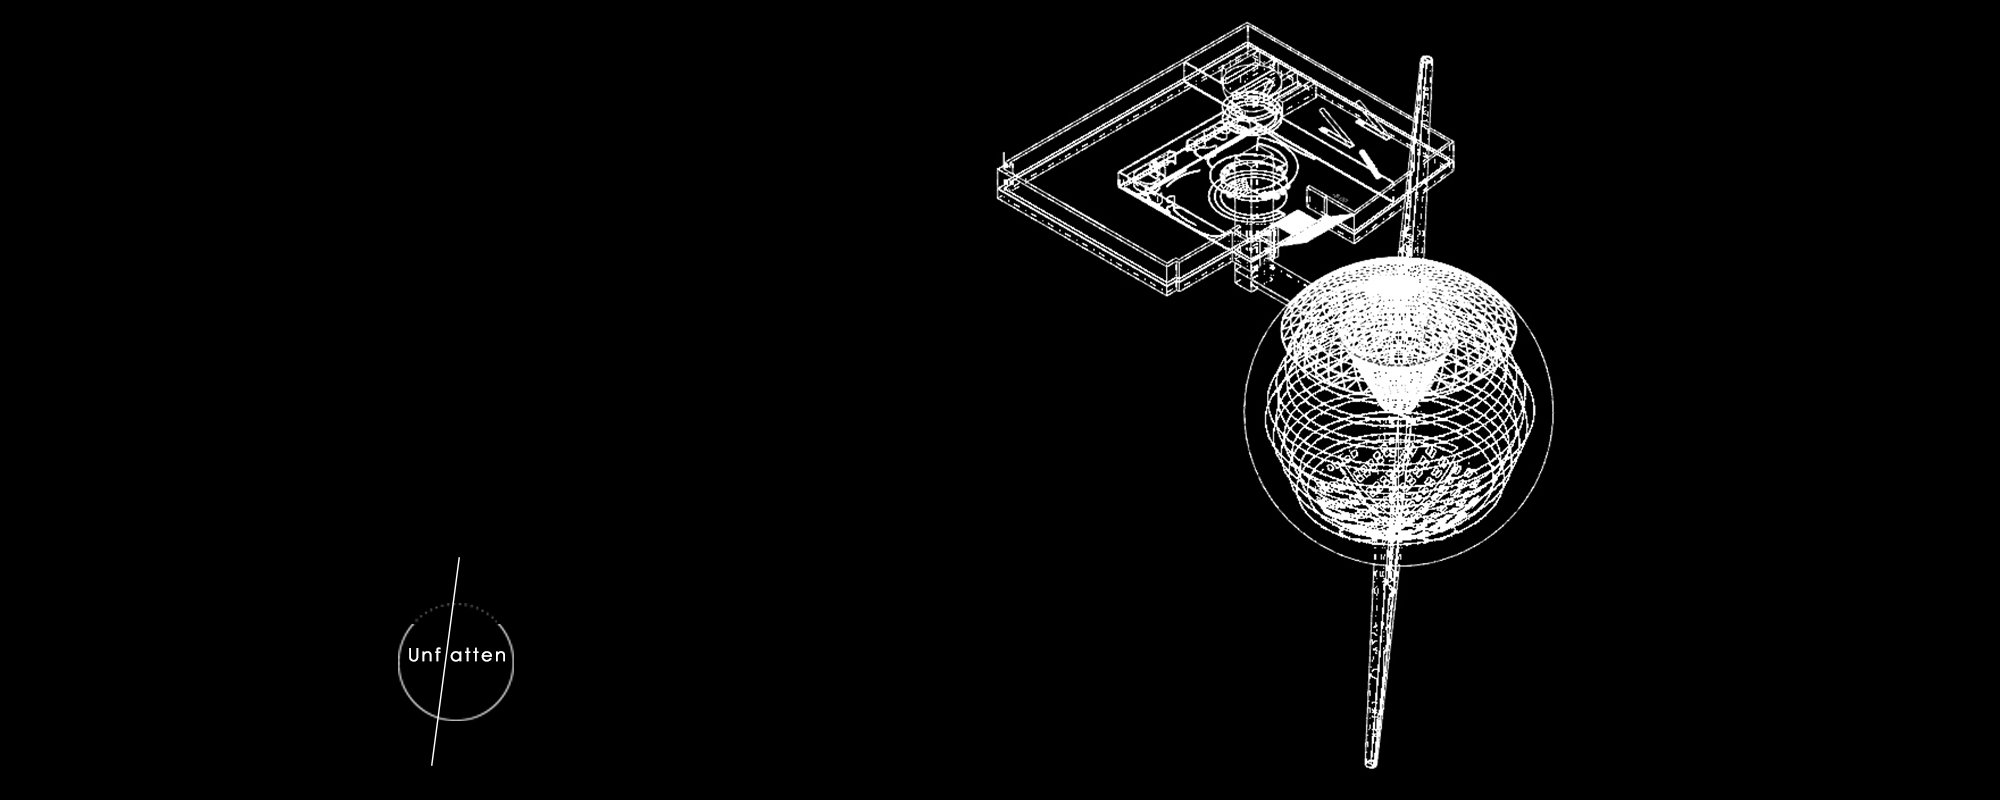
Unflatten by Olga Miskovic, an experimental school for the Bauhaus Neue competition, grew from the Bauhaus principle of care for human well-being. Its cover is a white wireframe on black, an axonometric in which a flat slab and a spherical volume are threaded on one long axis.
Other members use the format at the scale of a pavilion or a public sculpture. Wave 'Coral' by Dongpei Yue, 国一 黄 and Xiaoqian Zhou, an Editor's Choice in Sculpt[r] 2020, sets out to solve practical problems and also to enhance the interpretation of heritage. Lynus Lim's Iridescence, a pavilion for Terra x Terra, perforates its form to create a dialogue between dark and light. Museum of Materials by Riyadh Fernini, Dina Kishi and Lina Aldabbagh, entered in the Haptic competition, starts by shaping a visitor's feelings before they enter, then enriches the tactile and visual journey through the building. Village 4 Network by Christodoulos Saraferas and Sotiris Grigoropoulos, a mixed-use building for Singapore's waterfront that combines working and living, explains its form as twelve small massing steps, and Theatre Lane by chris tucker, an entry in the Nano Nest 2020 competition, highlights one move at a time in orange. ElectricVibes by Gabriela Doktór and Natalia Marczyńska, a winning entry in the ElectriCITY competition, adapts an old power plant in Philadelphia, a reuse brief where diagrams separate what stays from what is new.

For background reading, the UNI journal on architectural diagrams surveys diagram types and techniques and argues that a diagram's value lies in making a design understandable to clients and stakeholders as well as builders.
Challenges and future directions
The most common failure of a 3D diagram is that it tries to say too much. When structure, programme, circulation and sunlight are all drawn on one model, the result is a dense picture that is harder to read than the plan it was meant to clarify. One question per diagram is still the most useful rule.
The second problem is drift towards rendering. Modelling software makes it easy to add textures, shadows and entourage to a diagram, and every addition competes with the idea. Many of the strongest boards keep the diagram monochrome and use one accent colour for the element being explained.
A third challenge is honesty. A diagram is persuasive precisely because it simplifies, so it can make a weak idea look inevitable. A useful safeguard is to derive every diagram from the actual design model rather than drawing it as an illustration afterwards.
The direction of travel is towards diagrams that move: process sequences exported as animations, interactive models that let a viewer toggle layers, and analysis diagrams generated from simulation data for daylight or airflow. The underlying discipline does not change. The drawing still has to choose what to leave out.
3D diagrams for students and designers
For students, the 3D diagram is often the drawing that decides how a board is read. A strong thesis or competition board usually leads with one clear concept diagram, then supports it with programme, structure and circulation diagrams at a smaller size. Useful thesis angles include a diagram atlas of a single building type, a study of how one historical diagram (Howard's, Choisy's or Le Corbusier's) shaped later practice, or a project in which every design decision is documented as a diagram sequence.

HOUSE OF ANGELS by Shrief Adel, sohila mohamed and Mazen Ayman, an Editor's Choice in the Respites competition, shows how a board balances text, plan and imagery; a 3D diagram is the drawing that can tie those pieces into one argument. Open briefs on the uni.xyz competitions page are a good place to practise, since a fixed number of boards rewards clarity over volume.
Frequently asked questions
What is the difference between a 3D diagram and a 3D render?
A render shows what a building will look like, with materials, light and people. A 3D diagram shows how it works, keeping only the elements that explain one idea, such as structure or circulation. Most presentation sets need both, but they answer different questions.
What are the main types of architectural diagrams?
The common types are concept diagrams, programme and massing diagrams, circulation diagrams, structure diagrams, environmental diagrams and process sequences. Each answers one question about the design, and a typical board uses three or four of them.
Which projection is best for a 3D architectural diagram?
Axonometric projections are the usual choice because they keep elements to scale and show several sides of an object at once. Perspective is better when the diagram must show the experience of a space, for example a route seen at eye level.
How do I make a clear 3D diagram?
Start from the model, reduce it to simple volumes, choose one idea to explain, and use a single accent colour for the element that carries that idea. Add short labels rather than paragraphs, and test whether someone can understand the diagram without reading the board's text.
References and further reading
- Architectural drawing, Wikipedia
- Diagram, Wikipedia
- Jean-Nicolas-Louis Durand, Wikipedia
- Choisy, Auguste, Dictionary of Art Historians
- Garden Cities of To-morrow by Ebenezer Howard, Project Gutenberg
- Maison Dom-Ino, Sans lieu, 1914, Fondation Le Corbusier
- Richards Medical Research Laboratories, Wikipedia


Popular projects
View all 52 projects


Latest journals
View all 4 journals
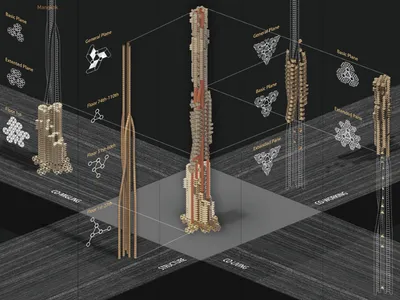
Architectural Diagrams: Types, Techniques, and Technological Advances
This article explores the significance, creation, and evolution of architectural diagrams, which are essential tools for architects to visualize, communicate, and execute building designs.




Understanding Linking Levels
A structure creating opportunities for social experiences by linking the change in height.


